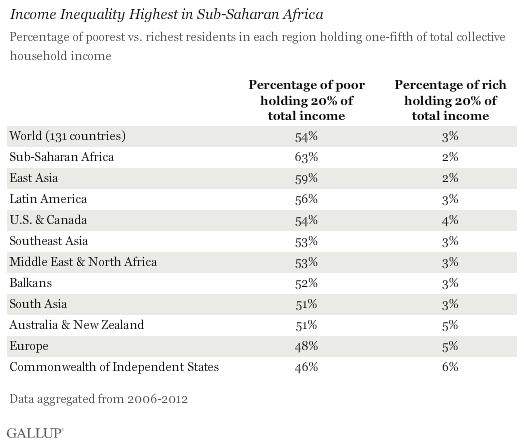
WASHINGTON, D.C. -- Across 131 countries worldwide, the richest 3% of residents hold 20% of the total collective household income -- as do the poorest 54%. In other words, the 3% reporting the highest household incomes share the same "slice" of collective income across countries that more than half of residents worldwide -- those on the lower end of the income scale -- must share. Income inequality levels are highest in sub-Saharan Africa and East Asia (predominantly China).
Income inequality is a significant barrier to development in many poor and transitional countries, as quality of life and human development indicators may remain stagnant even as gross domestic product rises if the added wealth benefits only a small share of the population. Princeton economist and Gallup Senior Scientist Angus Deaton discusses the effects of such gaping discrepancies in his new book, The Great Escape: Health, Wealth, and the Origins of Inequality.
A lack of information about how household income is distributed within a country is often cited as a shortcoming of traditional income measures such as per capita GDP. One of the simplest ways to assess income inequality is to look at the share of the population's total reported income that is held by a given percentage of residents with the highest incomes -- say, the top 3%.
Chronic Income Inequality Hinders African Development
Many sub-Saharan African countries have seen strong economic growth over the past decade, driven largely by high global demand for their exports, as well as rising foreign investment. However, much of the resulting wealth is controlled by regimes that fail to invest enough in public services or infrastructure that would improve the poor's access to economic opportunities.
In oil-rich Nigeria, for example, GDP has grown by at least 6% each year since 2006, despite the global recession. However, the richest 6% of Nigerians hold 40% of the population's total household income. GDP growth has not translated to substantial poverty reduction or job creation.
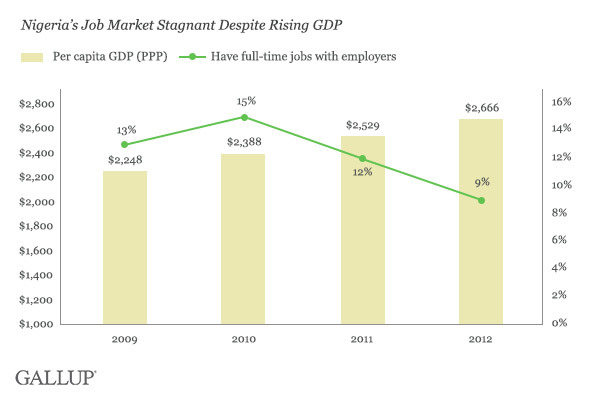
Income data collected in 2011 and 2012 indicate 44% of Nigerians are living on $1.25 per day or less (in international dollars), up from 31% in the 2007-2008 period. Further, there has been no consequent rise in the percentage of Nigerians with stable employment. In 2012, just 9% of Nigerians said they work full time for an employer, down from 15% in 2010.
Income Distribution in U.S. Similar to Global Results
Though income inequality is most acute in developing regions such as sub-Saharan Africa, it has become a significant concern in developed regions as well in the wake of the global financial crisis. Gallup's aggregated income data from 2006 to 2012 estimate that the richest 4% of Americans and the poorest 54% each hold one-fifth of the country's collective household income -- similar to the global data.
Results from the world's other largest economies vary. In China, the richest 2% and the poorest 60% each hold one-fifth of the collective household income, while in Japan the results are less extreme, at 5% and 46%, respectively.
Bottom Line
High levels of income inequality have been associated with a variety of social problems such as poverty, crime, and social instability, particularly in countries where living standards are low for most residents. For example, in Tunisia in the years prior to the 2011 revolution, the country's total per capita GDP was climbing while its income gap was widening significantly, partly because of rising unemployment. Even as the country overall was getting richer, more Tunisians were experiencing poverty, and their average life evaluations were falling.
The resulting hardship ultimately contributed to revolution, which in turn triggered unrest among other disadvantaged Arab-world populations. It also clearly demonstrated the importance to global leaders of tracking income distribution, especially in times of rapid economic change.
For complete data sets or custom research from the more than 150 countries Gallup continually surveys, please contact us.
Survey Methods
Results are based on telephone and face-to-face interviews with approximately 1,000 adults, aged 15 and older, per survey administration. Income data come from interviews conducted in 131 countries and regions from 2006 to 2012. Data for each country have been aggregated over multiple administrations; at least 2,000 interviews are required for a country to be included in the income data set. For results based on each sample of national adults, one can say with 95% confidence that the maximum margin of sampling error ranged from ±1.4 percentage points to ±4.7 percentage points. The margin of error reflects the influence of data weighting. In addition to sampling error, question wording and practical difficulties in conducting surveys can introduce error or bias into the findings of survey data.
With some exceptions, all samples are probability based and nationally representative of the resident population aged 15 and older. Exceptions include areas where the safety of interviewing staff is threatened, and in some countries, scarcely populated islands or areas that the interviewers can reach only by foot, animal, or small boat.
For more complete methodology and specific survey dates, please review Gallup's Country Data Set details.